Build trusted analytics,
Build trusted analytics,
Keep them from breaking.
Keep them from breaking.
Silicon brings self-serve analytics and data reliability into one platform: governed answers, dashboards, reports, schema checks, and pipeline fixes.
TRUSTED BY MODERN TEAMS
DATA ENGINEERS
ANALYTICS ENGINEERS
DATA ANALYSTS
BI TEAMS
PRODUCT
Revops
FINANCE
MARKETING
CUSTOMER SUCCESS
DATA ENGINEERS
ANALYTICS ENGINEERS
DATA ANALYSTS
BI TEAMS
PRODUCT
Revops
FINANCE
MARKETING
CUSTOMER SUCCESS
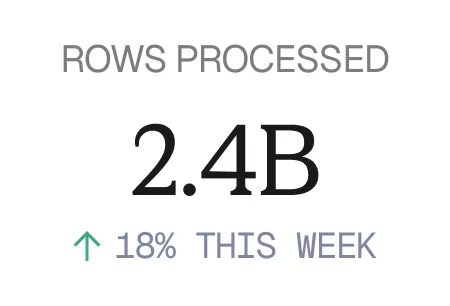
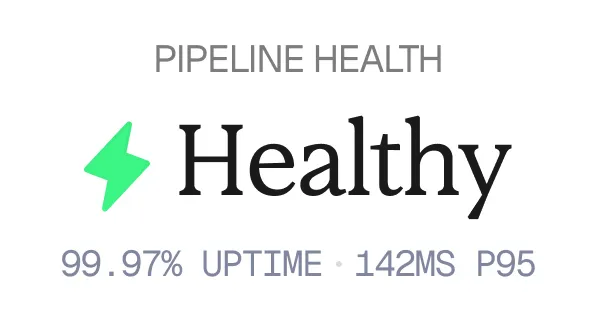
[ PROBLEM ]
[ PROBLEM ]
Analytics
infrastructure is broken.
[1]
87%
of organizations have low BI and analytics maturity. Most businesses collect data but lack the governance and tooling to turn it into trusted decisions.
Source: Gartner Maturity Assessment
[2]
44%
of data workers’ time is spent on data wrangling - finding, cleaning, and preparing data - rather than on actual analysis and insight generation.
Source: Forrester - The State of Data, 2023
[3]
60%
of data teams experienced a breaking schema change in the last 6 months. Column renames, model changes, and failed jobs silently broke dashboards, reports, and downstream metrics.
Source: Monte Carlo - State of Data Quality, 2024
[4]
31%
of business users trust their company’s data. The rest work with conflicting metrics, different definitions, and answers that change depending on who they ask.
Source: KPMG - Data & Analytics Survey
[1]
87%
of organizations have low BI and analytics maturity. Most businesses collect data but lack the governance and tooling to turn it into trusted decisions.
Source: Gartner Maturity Assessment
[2]
44%
of data workers’ time is spent on data wrangling - finding, cleaning, and preparing data - rather than on actual analysis and insight generation.
Source: Forrester - The State of Data, 2023
[3]
60%
of data teams experienced a breaking schema change in the last 6 months. Column renames, model changes, and failed jobs silently broke dashboards, reports, and downstream metrics.
Source: Monte Carlo - State of Data Quality, 2024
[4]
31%
of business users trust their company’s data. The rest work with conflicting metrics, different definitions, and answers that change depending on who they ask.
Source: KPMG - Data & Analytics Survey
[1]
87%
of organizations have low BI and analytics maturity. Most businesses collect data but lack the governance and tooling to turn it into trusted decisions.
Source: Gartner Maturity Assessment
[2]
44%
of data workers’ time is spent on data wrangling - finding, cleaning, and preparing data - rather than on actual analysis and insight generation.
Source: Forrester - The State of Data, 2023
[3]
60%
of data teams experienced a breaking schema change in the last 6 months. Column renames, model changes, and failed jobs silently broke dashboards, reports, and downstream metrics.
Source: Monte Carlo - State of Data Quality, 2024
[4]
31%
of business users trust their company’s data. The rest work with conflicting metrics, different definitions, and answers that change depending on who they ask.
Source: KPMG - Data & Analytics Survey
AI changed everything. Teams now expect instant answers, automated reports, and copilots that understand their business. But generic BI and point-and-click tools are too static. You need a system that reads your data the way humans do - with context, governance, and proactive protection.
AI changed everything. Teams now expect instant answers, automated reports, and copilots that understand their business. But generic BI and point-and-click tools are too static. You need a system that reads your data the way humans do - with context, governance, and proactive protection.
[ INTRODUCING SILICON ]
Silicon simplifies
trusted data work.
Arctic Accounts Payable Overview
Arctic Accounts Payable Overview
Breakdown of invoice processing, payment velocity, vendor spend, and AI automation across Ramp's AP platform.
Breakdown of invoice processing, payment velocity, vendor spend, and AI automation across Ramp's AP platform.
$4.2M
$4.2M
Total Q3
Invoices Processed
Total Q3
Invoices Processed
14.2% vs last quarter
14.2% vs last quarter
1.8 days
1.8 days
Avg Time to Payment
Avg Time to Payment
2.1 days faster
vs last quarter
2.1 days faster
vs last quarter
91%
91%
Auto-Coding Accuracy
Auto-Coding Accuracy
14.2% vs last quarter
14.2% vs last quarter
$127K
$127K
Cashback Earned
Cashback Earned
22.5% vs last quarter
22.5% vs last quarter
Invoice Volume & Processing Time (Q1–Q3)
Invoice Volume & Processing Time (Q1–Q3)
Invoice Count
Invoice Count
Days to pay
Days to pay
600
600
500
500
400
400
300
300
200
200
100
100
0
0
Jan
Jan
Feb
Feb
Mar
Mar
Apr
Apr
May
May
Jun
Jun
Jul
Jul
Aug
Aug
Sep
Sep
5 days
5 days
4 days
4 days
3 days
3 days
2 days
2 days
1 days
1 days
0 days
0 days
Invoice Value vs Processing Speed by Vendor
Invoice Value vs Processing Speed by Vendor
Paid
Paid
Pending
Pending
Flagged
Flagged
Days to Process
Days to Process
Invoice Value ($K)
Invoice Value ($K)
4.5d
4.5d
3.5d
3.5d
2.5d
2.5d
1.5d
1.5d
0.5d
0.5d
$0k
$0k
$0k
$0k
$0k
$0k
$0k
$0k
$0k
$0k
$0k
$0k
Vendor
Vendor
All Vendors
All Vendors
Category
Category
All Categories
All Categories
Status
Status
All Statuses
All Statuses
QUARTER
QUARTER
Q3
Q3
Avg Annual Claim Cost by Member Cohort (Q1–Q3)
Avg Annual Claim Cost by Member Cohort (Q1–Q3)
45–55, Metro
45–55, Metro
₹38,400
₹38,400
₹33,800
₹33,800
₹31,100
₹31,100
₹20,600
₹20,600
₹12,100
₹12,100
₹9,400
₹9,400
55+, Tier 1
55+, Tier 1
Diabetic cohort
Diabetic cohort
35–44, Metro
35–44, Metro
25–34, Tier 2
25–34, Tier 2
Family floater
Family floater
Paid
Paid
Pending
Pending
Flagged
Flagged
Flagged
Flagged
Arctic Accounts Payable
Arctic Accounts Payable
Share
Share
Recovering from Nov 11
Recovering from Nov 11
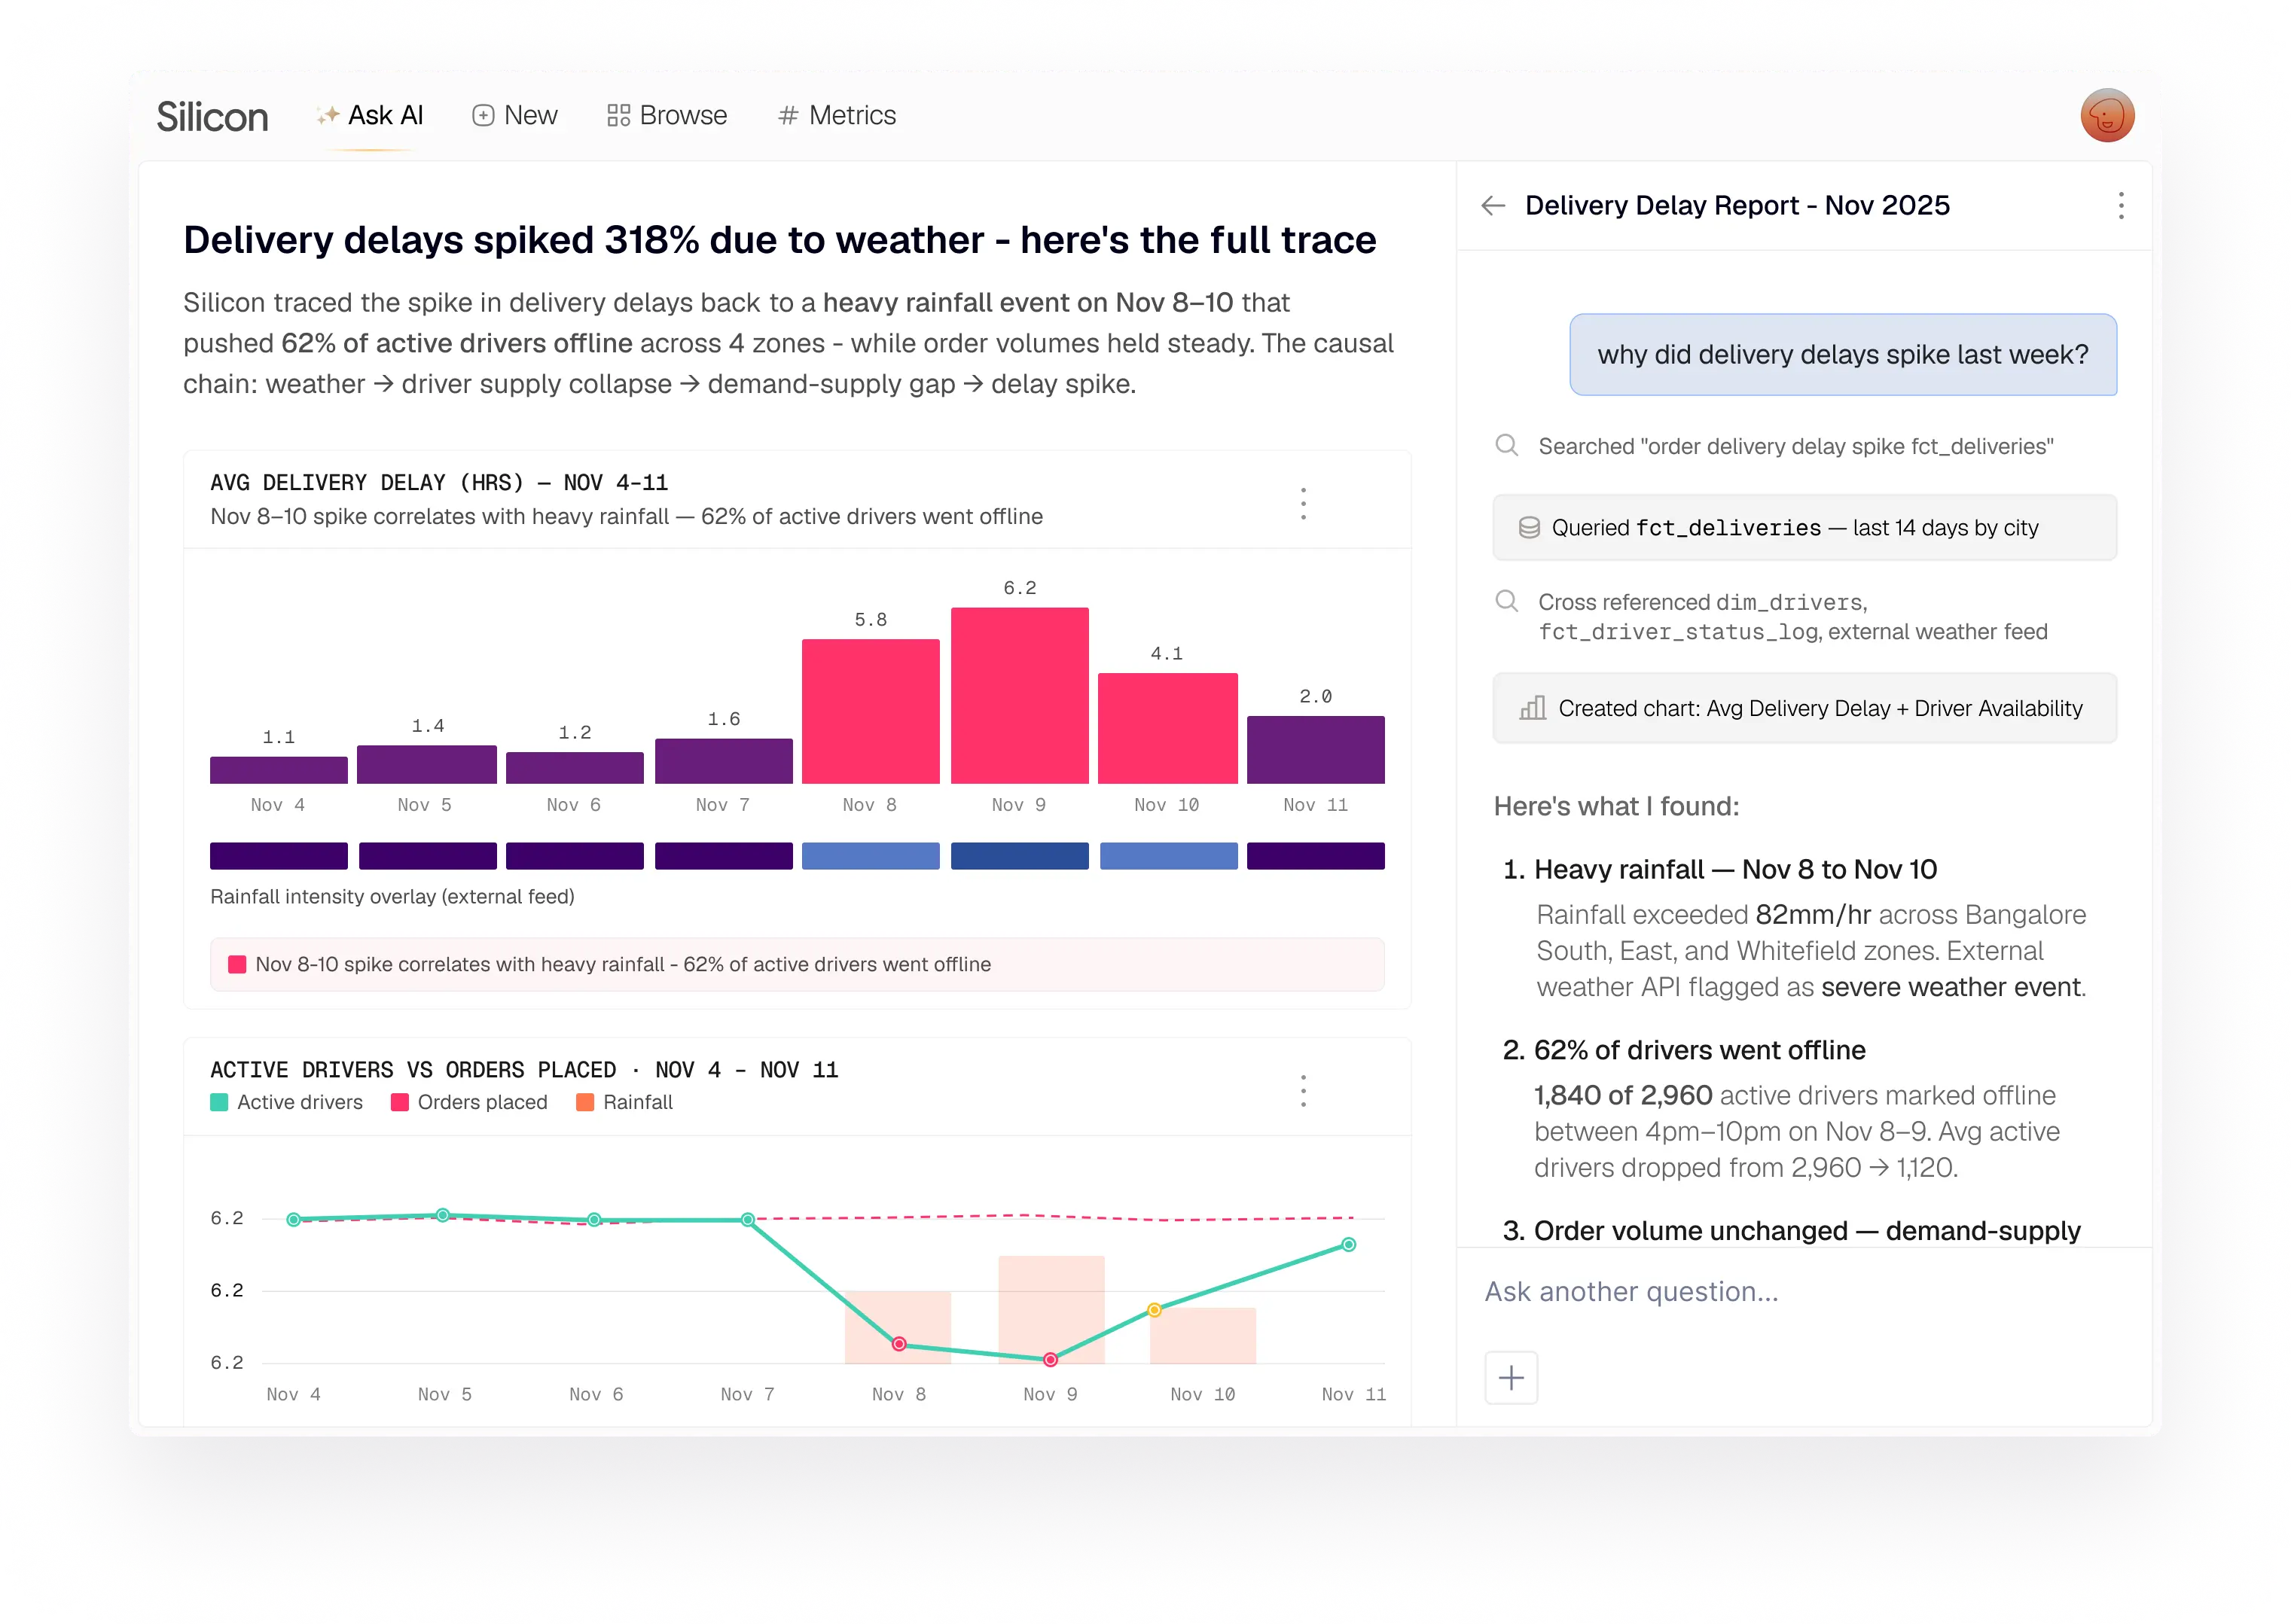
Driver availability normalized. Delay avg back to 2.0 hrs as of the Nov 11 - within SLA.
Driver availability normalized. Delay avg back to 2.0 hrs as of the Nov 11 - within SLA.
Delivery delays spiked 318% due to weather - here's the full trace
Delivery delays spiked 318% due to weather - here's the full trace
Silicon traced the spike in delivery delays back to a heavy rainfall event on Nov 8–10 that pushed 62% of active drivers offline across 4 zones - while order volumes held steady. The causal chain: weather → driver supply collapse → demand-supply gap → delay spike.
Silicon traced the spike in delivery delays back to a heavy rainfall event on Nov 8–10 that pushed 62% of active drivers offline across 4 zones - while order volumes held steady. The causal chain: weather → driver supply collapse → demand-supply gap → delay spike.
Avg Delivery Delay (hrs) — Nov 4–11
Avg Delivery Delay (hrs) — Nov 4–11
Nov 8–10 spike correlates with heavy rainfall — 62% of active drivers went offline
Nov 8–10 spike correlates with heavy rainfall — 62% of active drivers went offline
Rainfall intensity overlay (external feed)
Rainfall intensity overlay (external feed)
1.1
1.1
Nov 4
Nov 4
Nov 5
Nov 5
Nov 6
Nov 6
Nov 7
Nov 7
Nov 8
Nov 8
Nov 9
Nov 9
Nov 10
Nov 10
Nov 11
Nov 11
1.4
1.4
1.2
1.2
1.6
1.6
5.8
5.8
6.2
6.2
4.1
4.1
2.0
2.0
Nov 8-10 spike correlates with heavy rainfall - 62% of active drivers went offline
Nov 8-10 spike correlates with heavy rainfall - 62% of active drivers went offline
Active drivers vs orders placed · Nov 4 – Nov 11
Active drivers vs orders placed · Nov 4 – Nov 11
Active drivers
Active drivers
Orders placed
Orders placed
Rainfall
Rainfall
Orders held steady at ~14,200/day while drivers collapsed to 1,120 - each active driver absorbing 2.6× normal load
Orders held steady at ~14,200/day while drivers collapsed to 1,120 - each active driver absorbing 2.6× normal load
6.2
6.2
6.2
6.2
6.2
6.2
6.2
6.2
Nov 4
Nov 4
Nov 5
Nov 5
Nov 6
Nov 6
Nov 7
Nov 7
Nov 8
Nov 8
Nov 9
Nov 9
Nov 10
Nov 10
Nov 11
Nov 11
Ask AI
Ask AI
How this chart was built
How this chart was built
How this chart was built
+3
+3
+3
Reasoning
Reasoning
Reasoning
Applying query rules to fct_claims — cross-referencing dim_members for age and city...
Applying query rules to fct_claims — cross-referencing dim_members for age and city...
Applying query rules to fct_claims — cross-referencing dim_members for age and city...
Ethos member cohort claim analysis
Ethos member cohort claim analysis
Ethos member cohort claim analysis
Here's what I found in the fct_claims and dim_members tables (powered by the Ethos Member semantic model):
Here's what I found in the fct_claims and dim_members tables (powered by the Ethos Member semantic model):
Here's what I found in the fct_claims and dim_members tables (powered by the Ethos Member semantic model):
Members aged 45–55, metro cities — avg claim cost ₹38,400/yr, highest churn at renewal: 34%
Members aged 45–55, metro cities — avg claim cost ₹38,400/yr, highest churn at renewal: 34%
Members aged 45–55, metro cities — avg claim cost ₹38,400/yr, highest churn at renewal: 34%
Members with 2+ OPD consultations in first 60 days — claim cost 2.1× lower than those with 0 OPD visits
Members with 2+ OPD consultations in first 60 days — claim cost 2.1× lower than those with 0 OPD visits
Members with 2+ OPD consultations in first 60 days — claim cost 2.1× lower than those with 0 OPD visits
Diabetes + hypertension comorbidity cohort — avg hospitalisation ₹91,200; only 18% enrolled in wellness program
Diabetes + hypertension comorbidity cohort — avg hospitalisation ₹91,200; only 18% enrolled in wellness program
Diabetes + hypertension comorbidity cohort — avg hospitalisation ₹91,200; only 18% enrolled in wellness program
Members who used diagnostics at least once in Q2 had 61% lower hospitalisation rate in Q3
Members who used diagnostics at least once in Q2 had 61% lower hospitalisation rate in Q3
Members who used diagnostics at least once in Q2 had 61% lower hospitalisation rate in Q3
₹300/month plan holders — highest volume, 48% lapse before month 4
₹300/month plan holders — highest volume, 48% lapse before month 4
₹300/month plan holders — highest volume, 48% lapse before month 4
Avg Annual Claim Cost by Member Cohort (Q1–Q3)
Avg Annual Claim Cost by Member Cohort (Q1–Q3)
Avg Annual Claim Cost by Member Cohort (Q1–Q3)
45–55, Metro
45–55, Metro
₹38,400
₹38,400
₹33,800
₹33,800
₹31,100
₹31,100
₹20,600
₹20,600
₹12,100
₹12,100
₹9,400
₹9,400
55+, Tier 1
55+, Tier 1
Diabetic cohort
Diabetic cohort
35–44, Metro
35–44, Metro
25–34, Tier 2
25–34, Tier 2
Family floater
Family floater
Ethos Healthcare — Member Analytics (Q3)
Ethos Healthcare — Member Analytics (Q3)
Ethos Healthcare — Member Analytics (Q3)
Renewal Churn Rate vs Avg Claim Cost by Cohort (Q3)
Renewal Churn Rate vs Avg Claim Cost by Cohort (Q3)
Renewal Churn Rate vs Avg Claim Cost by Cohort (Q3)
45–55, Metro
45–55, Metro
₹38,400
₹38,400
₹33,800
₹33,800
₹31,100
₹31,100
₹20,600
₹20,600
₹12,100
₹12,100
₹9,400
₹9,400
55+, Tier 1
55+, Tier 1
Diabetic cohort
Diabetic cohort
35–44, Metro
35–44, Metro
25–34, Tier 2
25–34, Tier 2
Family floater
Family floater
Ask another question...
Ask another question...
Ask another question...
Share
Share
Share
[1]
Define metric context once
Give Silicon the definitions your team already trusts: metrics, dimensions, tables, joins, ownership, and business rules.
[2]
Ask from live governed data
Anyone can ask in plain English and get charts, SQL, source context, and the reason behind the answer.
[3]
Protect what gets published
When data changes, Silicon checks downstream metrics, dashboards, and reports before the change reaches production.
[1]
Define metric context once
Give Silicon the definitions your team already trusts: metrics, dimensions, tables, joins, ownership, and business rules.
[2]
Ask from live governed data
Anyone can ask in plain English and get charts, SQL, source context, and the reason behind the answer.
[3]
Protect what gets published
When data changes, Silicon checks downstream metrics, dashboards, and reports before the change reaches production.
[ How Silicon works ]
Your data.
Your questions.
what it is used for?
what it is used for?
Answering, reporting, investigation, triage, and schema protection, all executed against your metrics, your data model, your permissions, and your escalation rules.
Answering, reporting, investigation, triage, and schema protection, all executed against your metrics, your data model, your permissions, and your escalation rules.
[ How Silicon works ]
Your data.
Your questions.
what it is used for?
Answering, reporting, investigation, triage, and schema protection, all executed against your metrics, your data model, your permissions, and your escalation rules.

[1]
Connect your repo
Link Silicon to your GitHub repository containing your dbt project. Silicon reads your models, metrics, and dashboard definitions.
[2]
Every PR is checked
When a developer opens a PR, Silicon compares the proposed schema against your live warehouse and downstream dashboards.
[3]
Impact flagged before merge
If a change would break a dashboard, report, or metric, Silicon comments on the PR with the exact model, column, and affected assets.
[4]
Fix PR auto-generated
Silicon can draft a fix PR updating downstream references. Review and merge — the dashboard never breaks in production.
[1]
Connect your repo
Link Silicon to your GitHub repository containing your dbt project. Silicon reads your models, metrics, and dashboard definitions.
[2]
Every PR is checked
When a developer opens a PR, Silicon compares the proposed schema against your live warehouse and downstream dashboards.
[3]
Impact flagged before merge
If a change would break a dashboard, report, or metric, Silicon comments on the PR with the exact model, column, and affected assets.
[4]
Fix PR auto-generated
Silicon can draft a fix PR updating downstream references. Review and merge — the dashboard never breaks in production.
[1]
Connect your repo
Link Silicon to your GitHub repository containing your dbt project. Silicon reads your models, metrics, and dashboard definitions.
[2]
Every PR is checked
When a developer opens a PR, Silicon compares the proposed schema against your live warehouse and downstream dashboards.
[3]
Impact flagged before merge
If a change would break a dashboard, report, or metric, Silicon comments on the PR with the exact model, column, and affected assets.
[4]
Fix PR auto-generated
Silicon can draft a fix PR updating downstream references. Review and merge — the dashboard never breaks in production.
[ Features ]
Built for product
and growth teams.
Built for product
and growth teams.
[1]
Ask in Slack
Ask in Slack
Drop a question in any channel. Get answers with charts right in the thread.
[2]
Cohort analysis
Cohort analysis
See how any metric behaves across user segments. Built-in, no SQL needed.
[3]
Retention funnels
Retention funnels
Visualize where users drop off. Identify the exact step to optimize.
Visualize where users drop off. Identify the exact step to optimize.
[4]
A/B test results
A/B test results
See impact with statistical significance. Know what’s working, what’s not.
[5]
Growth dashboards
Growth dashboards
Track KPIs that matter: DAU, activation, retention, LTV. Auto-updated.
[6]
Alerts that make sense
Alerts that make sense
Get notified when something actually matters. Not every tiny fluctuation.
[ INTRODUCING SILICON ]
Let Silicon handle
the data work for you.
[ SELF-SERVE ANALYTICS ]
Ask anything.
Get the right answers.
[1]
Semantic layer,
not guesswork
Generic AI guesses what a column means. Silicon uses the definitions your data team trusts, so root cause is traced not invented.
[3]
Scheduled reports,
always current
Set a report once. Silicon sends it to Slack or email on schedule, always pulled fresh from governed live data.
[2]
Ask in Slack,
Answer in seconds.
Anyone can ask in plain English and get charts, SQL, source context, and the reason behind the answer.
[4]
Define metric
context once
Give Silicon the definitions your team already trusts: metrics, dimensions, tables, joins, ownership, and business rules.
[1]
Semantic layer, not guesswork
Generic AI guesses what a column means. Silicon uses the definitions your data team trusts, so root cause is traced not invented.
[3]
Scheduled reports, always current
Set a report once. Silicon sends it to Slack or email on schedule, always pulled fresh from governed live data.
[2]
Ask in Slack, Answer in seconds.
Anyone can ask in plain English and get charts, SQL, source context, and the reason behind the answer.
[4]
Define metric context once
Give Silicon the definitions your team already trusts: metrics, dimensions, tables, joins, ownership, and business rules.
[ Dashboards as Code ]
Ship analytics
like software.
[1]
Version-controlled YAML
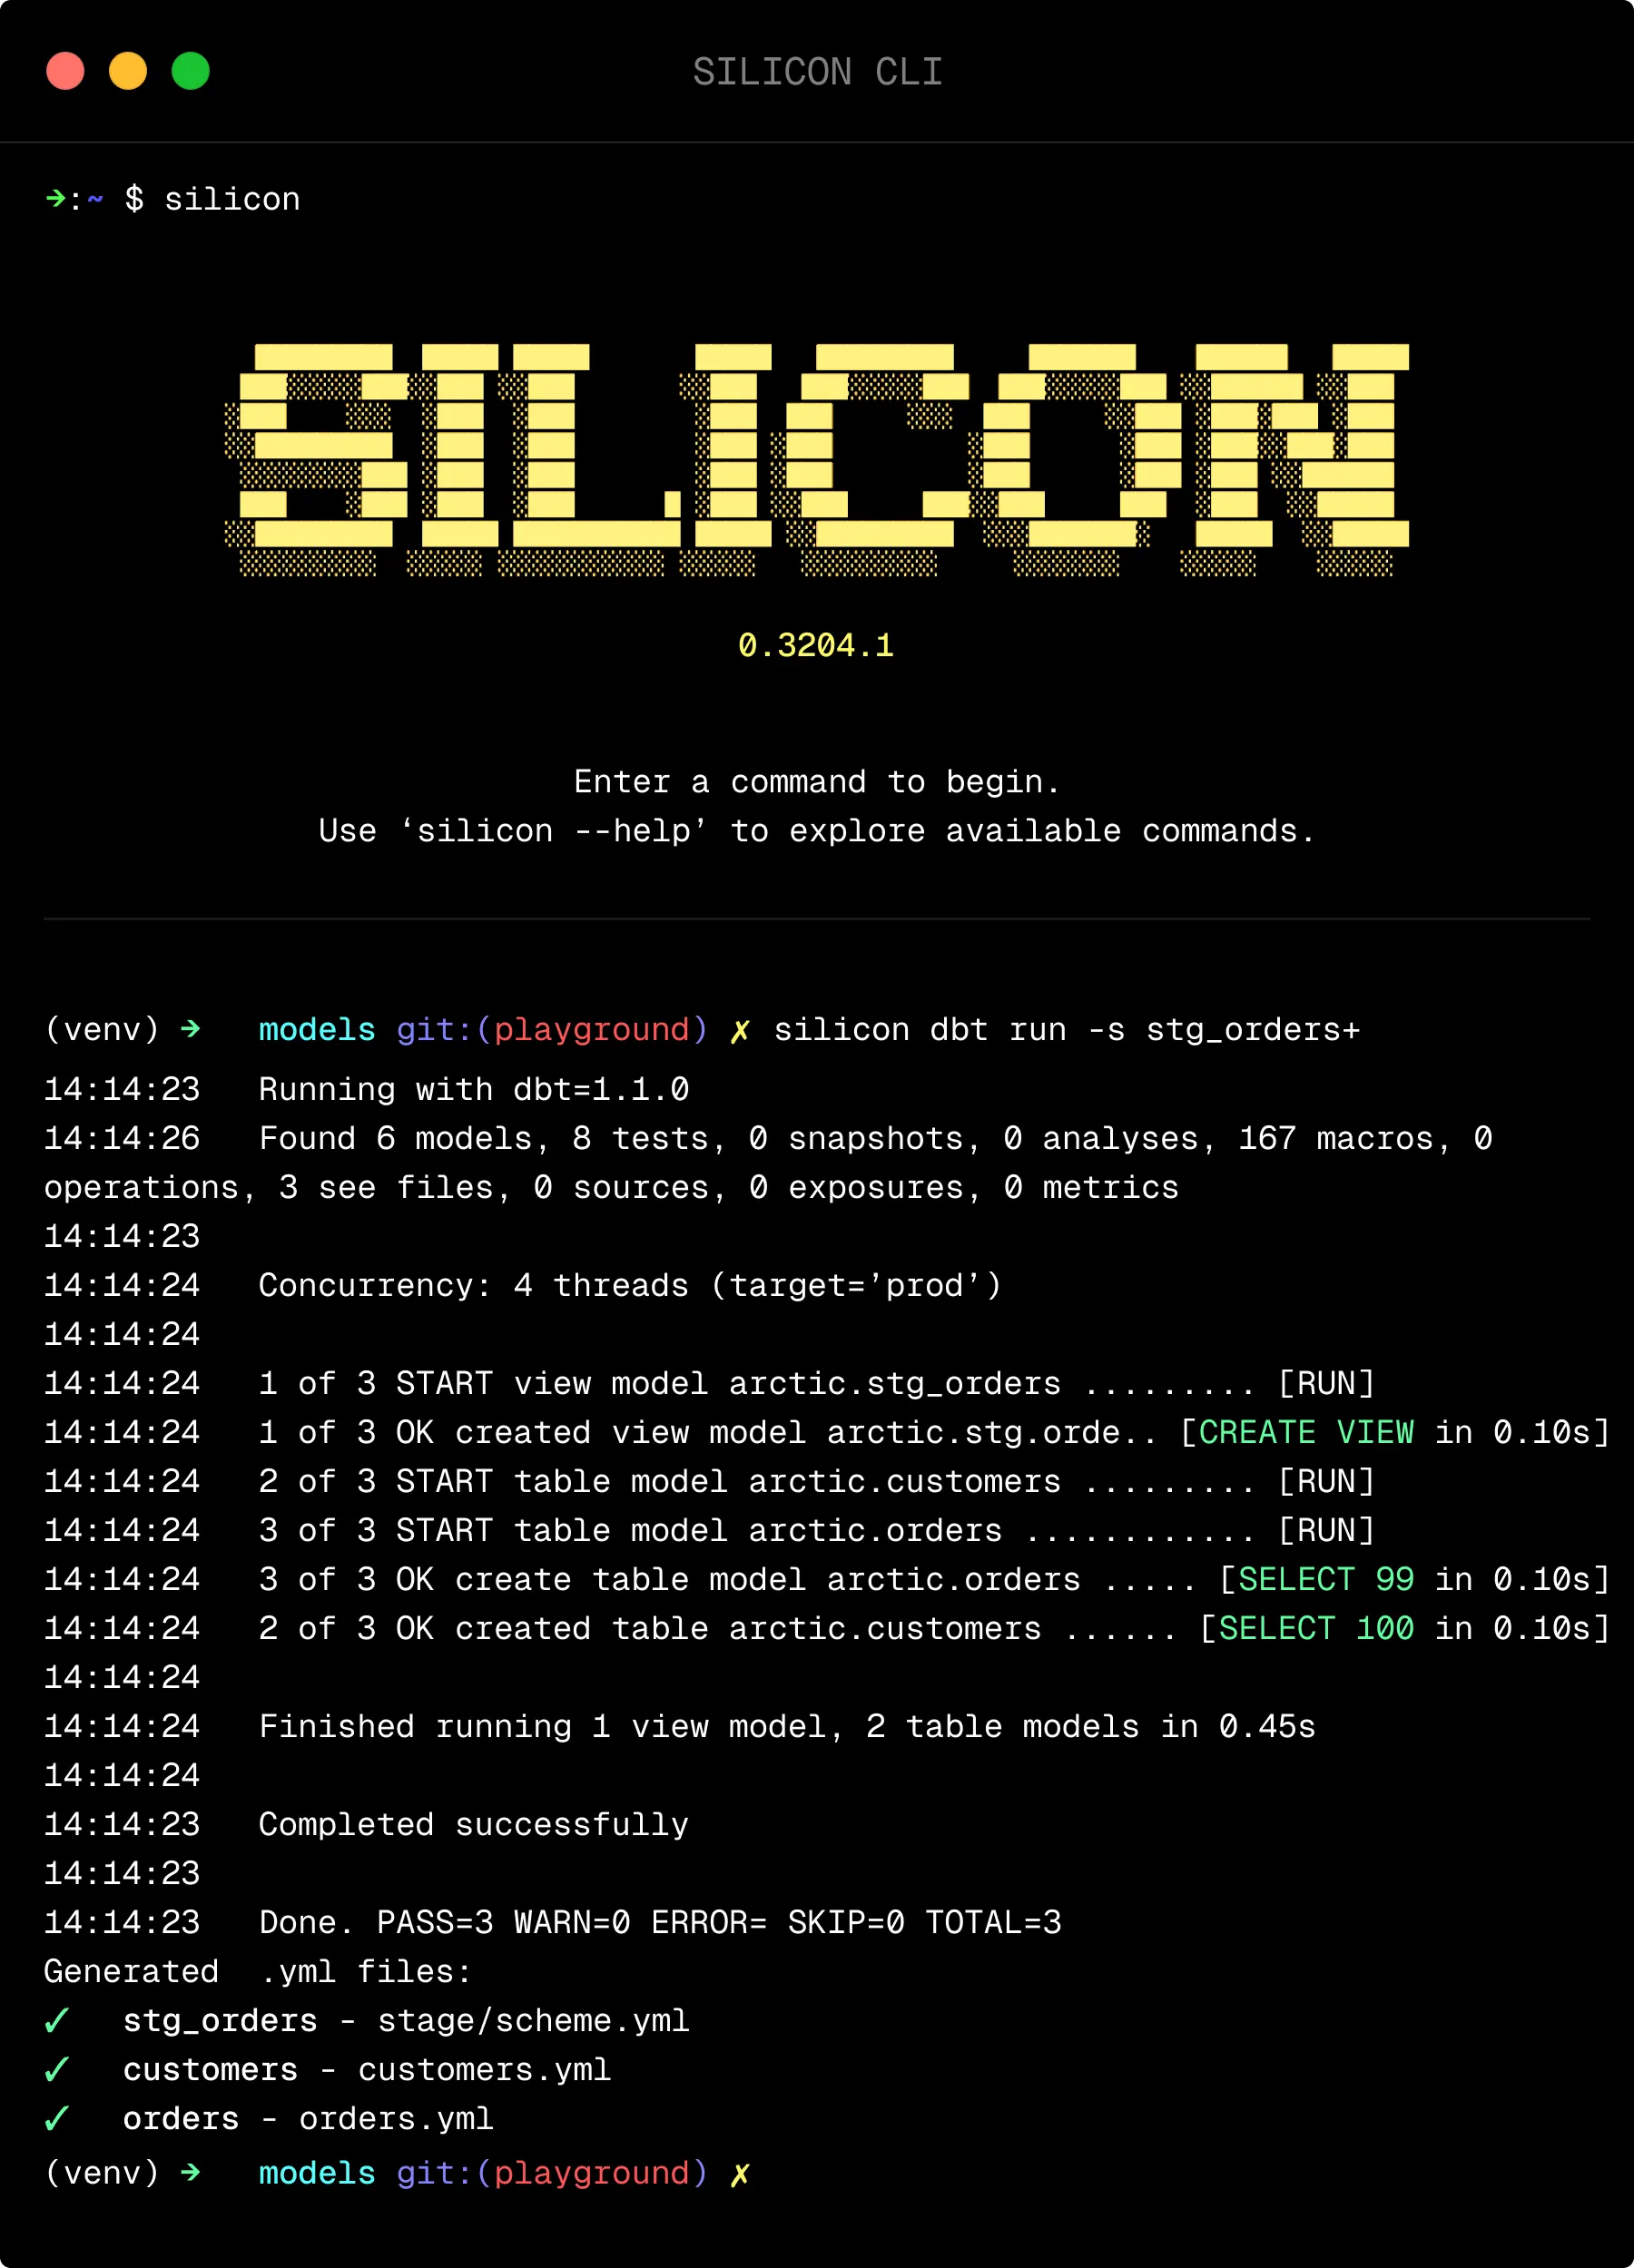
Every dashboard and chart lives as YAML alongside your dbt models. Committed, branched, reviewed, and merged like code.
[3]
Preview environments
Every branch gets its own preview. Review changes before they go live. Stakeholders approve visually.

[2]
CI/CD for BI
Automated tests run on every PR. Invalid metrics, broken joins, and schema mismatches are caught before merge.
[4]
One-click rollback
A dashboard broke in production? Revert to any previous version in seconds. Full audit trail included.
[1]
Version-controlled YAML
Every dashboard and chart lives as YAML alongside your dbt models. Committed, branched, reviewed, and merged like code.
[2]
Preview environments
Every branch gets its own preview. Review changes before they go live. Stakeholders approve visually.
[3]
CI/CD for BI
Automated tests run on every PR. Invalid metrics, broken joins, and schema mismatches are caught before merge.
[4]
Define metric context once
A dashboard broke in production? Revert to any previous version in seconds. Full audit trail included.
[1]
Version-controlled YAML
Every dashboard and chart lives as YAML alongside your dbt models. Committed, branched, reviewed, and merged like code.
[3]
Preview environments
Every branch gets its own preview. Review changes before they go live. Stakeholders approve visually.
[2]
CI/CD for BI
Automated tests run on every PR. Invalid metrics, broken joins, and schema mismatches are caught before merge.
[4]
Define metric context once
A dashboard broke in production? Revert to any previous version in seconds. Full audit trail included.
[ Schema Protection ]
Catch drift before
it breaks downstream.
[1]
PR-level impact checks
Every schema change is checked against all downstream dashboards, reports, and data apps before merge.
[3]
Slack and GitHub alerts
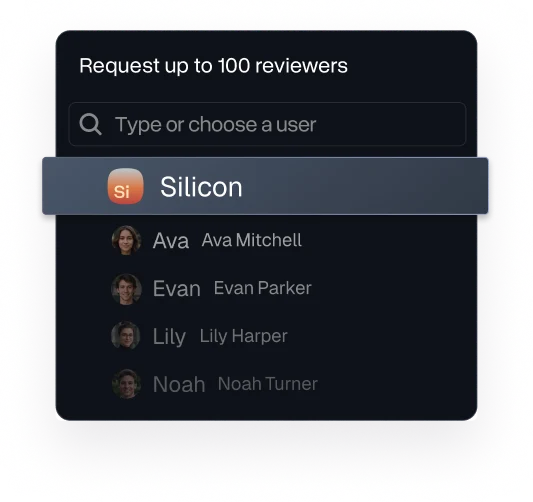
Broken changes trigger instant alerts with exact model, column, and affected assets. No more silent failures.

[2]
Root-cause trace
Silicon traces every broken metric back to the exact model, column, and commit that caused the change.
[4]
Auto-generated fix PRs
When a change breaks something, Silicon drafts a fix PR before your standup. Review and merge.
[1]
PR-level impact checks
Every schema change is checked against all downstream dashboards, reports, and data apps before merge.
[3]
Slack and GitHub alerts
Broken changes trigger instant alerts with exact model, column, and affected assets. No more silent failures.
[2]
Root-cause trace
Silicon traces every broken metric back to the exact model, column, and commit that caused the change.
[4]
Auto-generated fix PRs
When a change breaks something, Silicon drafts a fix PR before your standup. Review and merge.
[1]
PR-level impact checks
Every schema change is checked against all downstream dashboards, reports, and data apps before merge.
[3]
Slack and GitHub alerts
Broken changes trigger instant alerts with exact model, column, and affected assets. No more silent failures.
[2]
Root-cause trace
Silicon traces every broken metric back to the exact model, column, and commit that caused the change.
[4]
Auto-generated fix PRs
When a change breaks something, Silicon drafts a fix PR before your standup. Review and merge.
[ Data Apps ]
From prompt to
production app in minutes.
[1]
Forecasting
& scenario planning
Forecasting & scenario planning
Describe what you need. Silicon builds live forecasting tools with governed charts and adjustable assumptions.
[3]
Slide decks with live data
Slide deckswith live data
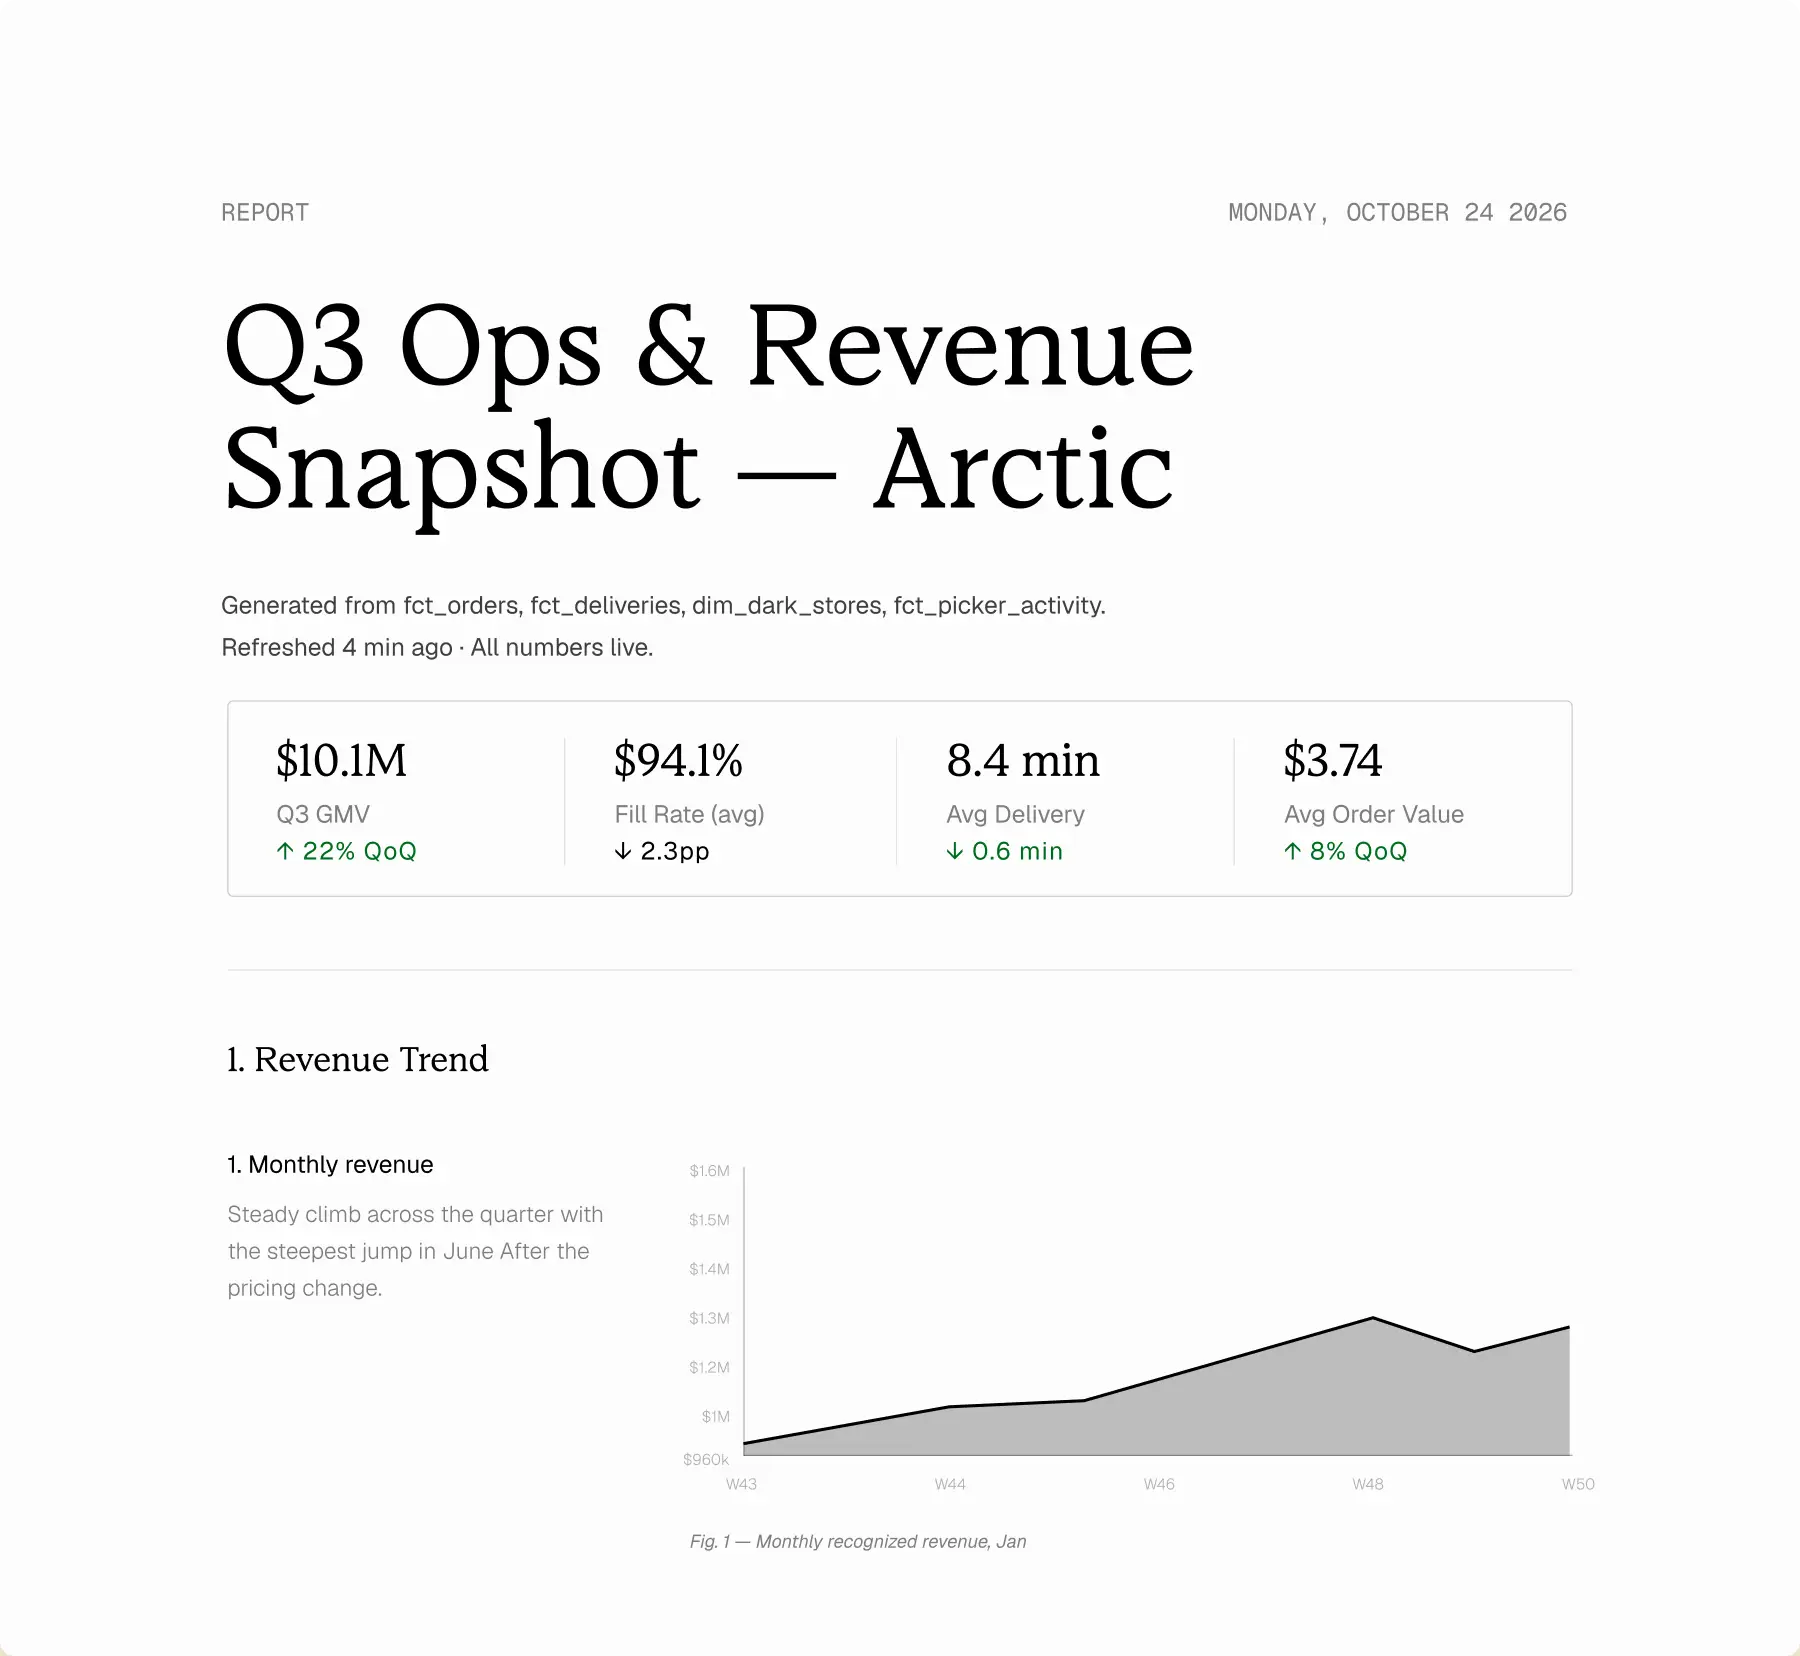
Auto-generate presentation-ready slides backed by your semantic layer. Update in one click when metrics change.

[2]
Embed anywhere
Embed anywhere
iframe or React SDK with row-level security, customer-level permissions, white-labeling, and SSO-ready controls.
[4]
Internal reports,
automated
Internal reports, automated
Weekly ops summaries, finance reviews, performance decks - auto-generated and delivered on schedule.
[1]
Forecasting & scenario planning
Describe what you need. Silicon builds live forecasting tools with governed charts and adjustable assumptions.
[3]
Slide decks with live data
Auto-generate presentation-ready slides backed by your semantic layer. Update in one click when metrics change.
[2]
Embed anywhere
iframe or React SDK with row-level security, customer-level permissions, white-labeling, and SSO-ready controls.
[4]
Internal reports, automated
Weekly ops summaries, finance reviews, performance decks - auto-generated and delivered on schedule.
[ why Silicon ]
The way data worked before.
The way it works now.
PRODUCT COMPARISON
Analytics answers
Product · Growth · Sales
Revenue alignment
Finance · Sales · Product
“Why did this spike?”
Product · Growth · Finance
Schema drift
Analytics Eng · Data Eng
Pipeline incidents
Data Engineer
Team capacity
Head of Data · Data Analyst
Before Silicon
File a ticket. Wait 3 days.
3 teams. 3 different revenue numbers.
AI guesses column names. Confident answer, wrong data.
Change ships silently. CEO finds out first.
Fails at 3am. Team finds out at 9am.
Most time lost to ad-hoc Slack questions.
After Silicon
Ask in Slack. Answer in seconds.
One definition. Every team agrees.
Semantic layer knows every column. Actual root cause traced.
Caught at the PR. Fix opened automatically.
Detected at 3am. Fix PR ready by standup.
Business teams self-serve. Analysts ship.
Product Comparison
Before Silicon
After Silicon
Analytics answers
Product · Growth · Sales
File a ticket. Wait 3 days.
Ask in Slack. Answer in seconds.
Revenue alignment
Finance · Sales · Product
3 teams. 3 different revenue numbers.
One definition. Every team agrees.
“Why did this spike?”
Product · Growth · Finance
AI guesses column names. Confident answer, wrong data.
Semantic layer knows every column. Actual root cause traced.
Schema drift
Analytics Eng · Data Eng
Change ships silently. CEO finds out first.
Caught at the PR. Fix opened automatically.
Pipeline incidents
Data Engineer
Fails at 3am. Team finds out at 9am.
Detected at 3am. Fix PR ready by standup.
Team capacity
Head of Data · Data Analyst
Most time lost to ad-hoc Slack questions.
Business teams self-serve. Analysts ship.
[ SECURITY ]
Enterprise-grade, from day one.
Enterprise-grade,
from day one.
Silicon brings self-serve analytics and data reliability into one platform: governed answers, dashboards, reports, schema checks, and pipeline fixes.
Silicon brings self-serve analytics and data reliability into one platform: governed answers, dashboards, reports, schema checks, and pipeline fixes.
Silicon brings self-serve analytics and data reliability into one platform: governed answers, dashboards, reports, schema checks, and pipeline fixes.
[1]
SSO / SAML
Okta, Azure AD, Google
[2]
SCIM 2.0
Automated provisioning
[3]
Row-level security
Column and row access policies
[4]
Audit logs
Every query, view, change logged
[5]
Read-only access
Data stays in your warehouse
[6]
No AI training
Your data never trains models
[7]
VPC / self-hosted
Deploy inside your network
[7]
VPC / Self-hosted
Deploy inside your network
[8]
SSH tunnels
Secure warehouse connections
[ Testimonial ]
The way data worked before.
The way it works now.
Anonymous
Ex-Portfolio Manager, Global Asset Manager
Silicon turned weeks of manual analysis into minutes. We finally had a single source of truth for every position, and that clarity completely changed how confidently our team made investment decisions.
Anonymous
Former Head of Data, Biotech Company
Before Silicon, our research data lived across a dozen disconnected systems. Now everything is unified and instantly searchable — it cut our reporting cycle in half and let our scientists focus on the work that matters.
Anonymous
Ex-VP of Operations, National Retailer
Silicon gave us real-time visibility across every store and warehouse. Forecasting that once took days now happens automatically, and the accuracy has directly improved our margins.
[ FAQ ]
Questions? We’ve got answers.
What is Silicon?
Silicon is an AI analytics platform with built-in data reliability. It helps teams ask questions, build dashboards, schedule reports, and protect downstream metrics as data changes.
Does Silicon replace our BI stack?
How does Silicon work?
How is Silicon different from traditional BI tools?
How does Silicon avoid hallucinated answers?
What happens when a schema changes?
Does Silicon connect to dbt?
Is Silicon secure for enterprise data?
[ LET'S TALK ]
Let's figure out if Silicon
fits your data stack.
Silicon
Silicon
Silicon